Microsoft Excel is widely used to prepare various types of analytical interactive reports for the top management who are at the planning stage. The latest buzzword in the world of Excel is Dashboard Reporting. A dashboard report is a management tool that measures and presents critical data on the key business performance areas in a summarized easy-to-read format. To prepare a smart dashboard report, you have to use various form controls, appropriate charts, functions to fetch summary data, various formatting and few tricks.
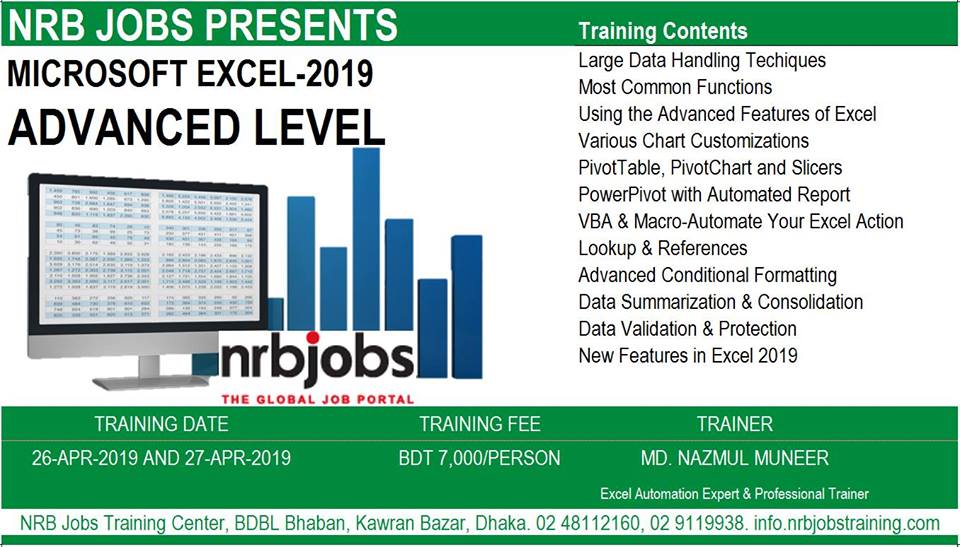
Training Contents:
- Cell Reference (Absolute Vs Relative)
- Use Essential Functions For Restructuring Usable Data Table
- Lookup & References
- Advanced Conditional Formatting
- Convert Number In Words Automatically
- Reporting Techniques Using Pivottables, Pivotchart And Slicers
- Powerpivot – Use The Most Powerful Feature In Excel (Bi Tool)
- Data Summarization & Aggregation Techniques From Large Data
- Data Sorting & Filtering
- Date Functions
- Error Handling And Cleaning Reports
- Data Validation And File Protection
- Creating Chart And Visual Presentation
- Macro & Vba: Automate Your Excel Action Or Report And Save Time
- Problem Solving Session
Location:
DhakaBenefits
- Opportunity to learn the latest features and tricks of Microsoft Excel
- 100% PRACTICAL with trainer’s pre-designed working files
- Opportunity to boost up the Excel skill
- Training lecture sheet that will be interactively connected with working data
- Opportunity to learn how to map and handle big data in Excel
- Opportunity to learn to generate the interactive reports describing the core information within seconds professionally
Eligibilities
Spreadsheet authors, Excel developers, regular Excel users and all kinds of analysts who want to gain skills in designing visual reports can apply to attend the workshop.
Eligible Regions: BangladeshApplication Process
- Apply online
- Registration Fees: BDT 7000/-
Application Deadline: April 21, 2019
Application ClosedOfficial link


